zig module code for data plotting using gnuplot (hence the name here with a "z" inserted, yielding gnuzplot)
-
basic idea: allow plotting of data vectors from within zig (pipe into child process of gnuplot)
-
simple demo: compile and run examples found in the example directory, or run zig tests
-
motivation: visualization of vectors or other data while they undergo manipulation within zig
-
requires: local installation of gnuplot (see www.gnuplot.info)
-
note: has been developed/tested in linux environment (Devuan), functionality on Windows not tried.
- gallery of figures with gnuzplot_ex:

```
// single plot
try plt.gridOn();
try plt.title("A simple signal from JSON data file");
try plt.plot( .{plot_data.s, "title 'sin pulse' with lines ls 5 lw 1"} );
```

```
// single plot with marker
try plt.gridOn();
try plt.title("now with line and point");
try plt.plot( .{plot_data.c, "title 'sin pulse' with linespoints ls 3 lw 2 pt 7 ps 2"} );
```

```
// double plot
try plt.gridOff();
try plt.title("Two other signals with transparency");
try plt.plot(.{
    plot_data.s,"title 'sin' with lines ls 14 lw 2",
    plot_data.n,"title 'sin in noise' with lines ls 25 lw 2"
});
```

```
// x vs. y line plot
try plt.title("x vs y line plot");
try plt.plotXY(.{
    plot_data.spx1,plot_data.spy1,"title 'x' with linespoints lw 1 pt 9 ps 2.3",
    plot_data.spx2,plot_data.spy2,"title 'x' with linespoints lw 2 pt 7 ps 2.3",
});
```

```
// x vs. y scatter plot
try plt.title("x vs y scatter plot with transparency");
try plt.plotXY(.{plot_data.bx,plot_data.by,"title 'x' with points ls 28 pt 7 ps 5"});
```
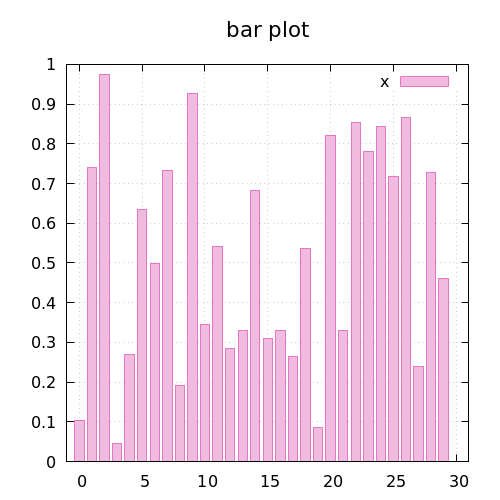
```
// simple bar plot
try plt.gridOn();
try plt.title("bar plot");
try plt.bar( .{plot_data.x, 0.75, "title 'x' ls 7 "} );
```

```
// shared bar plot
try plt.gridOn();
try plt.title("shared bar plot with three vectors");
try plt.bar( .{
    plot_data.x, 0.5, "title 'x' ls 33 ",
    plot_data.y, 0.5, "title 'y' ls 44 ",
    plot_data.z, 0.5, "title 'z' ls 55 "
} );
```
- emphasis: focus on plotting of DATA directly from within zig programs, typically gnuplot works either in an interactive mode, or scripted mode using data files.
gnuzplot pipes data directly to gnuplot using efficient wrappers for direct data plot (no need for intermediate files). A number of most common wrappers are implemented, but virtually any gnuplot command can be used by virtue of a cmd call from zig.
Plotting defaults to screen display, but creating output image files such as png is simple (pngcairo terminal setting is recommended in that case.)